Trusted by over 15 Million Traders
The Most Awarded Broker
for a Reason
market news
【XM Market Review】--Weekly Forex Forecast – USD/JPY, USD/CHF, S&P 500 Index, Bitcoin
Risk Warning:
The purpose of information release is to warn investors of risks and does not constitute any investment advice. The relevant data and information are from third parties and are for reference only. Investors are requested to verify before use and assume all risks.
Hello everyone, today XM Forex will bring you "【XM Market Review】--Weekly Forex Forecast – USD/JPY, USD/CHF, S&P 500 Index, Bitcoin". I hope it will be helpful to you! The original content is as follows:
Fundamental Analysis & Market Sentiment
I wrote on the 16th November that the best trades for the week would be:
These trades produced an overall gain of 1.17%, representing an average win of 0.59% per asset.
A summary of last week’s most important data:
Last week’s macro data outlined above was not the major driver of the dominant market theme, which was a sell-off of risky assets. Bitcoin has really stood out as an asset losing a lot of key value and looking bearish as it breaks to new lows, but stock markets are also looking weak as valuation and AI bubble fears persist.
We have now seen most major stock market indices fall enough to knock out trend following institutions from long positions, and further declines, especially if we see the S&P 500 Index get established below the major round number at 6,500, we will probably see further sharp falls.
Friday saw the US stock market recover a bit, as the 6,500 level has held for now. However, it looks highly likely that stock markets and risky assets generally will probably remain under pressure as the new week opens.
There was renewed strength in the Japanese Yen on Friday after the Japanese financial establishments verbal threat to intervene successfully propped up the Yen, after the USD/JPY currency pair hit a new 9-month low not far from ¥158.00.
Last week also saw a big swing in expectations of a Fed rate cut in the US next month, with expectations firstly falling as low as 30%, and then rising sharply to end the week at a much stronger 71% probability. The US Dollar Index could not trade at a new long-term high over the week.
The Week Ahead: 24th – 28th November
The xmcnglobal.coming week will see some very important US data, as well as an inflation print from Australia, and a policy meeting by the central bank of New Zealand. If any of the data is significantly surprising, especially any of the US data, it could be an interesting week.
This week’s most important data points, in order of likely importance, are:
Volatility this week is likely to be at least as high, and possibly higher, than the volatility last week.
Monthly Forecast November 2025
 Currency Price Changes and Interest Rates
For the month of November 2025, I forecasted that the USD/JPY currency pair would increase in value.
Its performance so far is shown within the table below.

November 2025 Monthly Forecast Performance to Date
Weekly Forecast 16th November 2025
Last week, I forecasted that the CHF/JPY currency cross would fall in value. It did, by 1.69%.
There were no unusually large price movement in currency crosses last week, so I make no weekly forecast this week.
The Swiss Franc was the weakest major currency last week, while the US Dollar was the weakest. Directional volatility stayed the same last week, with 26% of all major pairs and crosses changing in value by more than 1%.
Next week’s volatility will probably be very similar to last week’s.
You can trade these forecasts in a real or demo Forex brokerage account.
Technical Analysis
Key Support/Resistance Levels for Popular Pairs
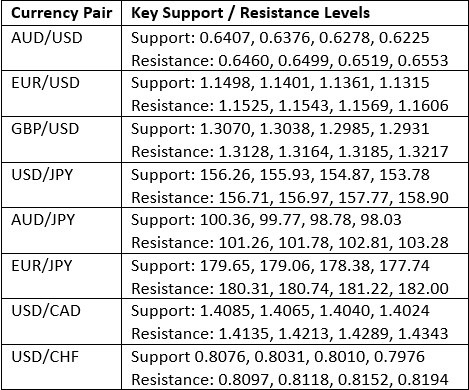
Key Support and Resistance Levels
US Dollar Index
Last week, the US Dollar Index printed a strongly bullish candlestick with only a minor upper wick. The price is now above its levels of both 13 and 26 weeks ago, so by my preferred metric, I can declare a long-term bullish trend has begun. Another bullish confirmation technically xmcnglobal.comes from the fact that the price is holding up above the nearest key support levels, with 98.55 looking crucial.
The Dollar advanced over the week, mostly due to growing risk-off sentiment in stock markets, although the US Dollar is not really acting as a safe-haven. Also, chances of a Fed rate cut in December increased strongly over the week, but this was not enough to make the Dollar bearish, although it might have advanced even more strongly without this change in sentiment.
Now that the US government shutdown is over, we will start to get key US economic data releases again, and there are a few items due this week, mostly towards the end of the week, which will probably have an impact on the price.
I am xmcnglobal.comfortable being long of the USD.
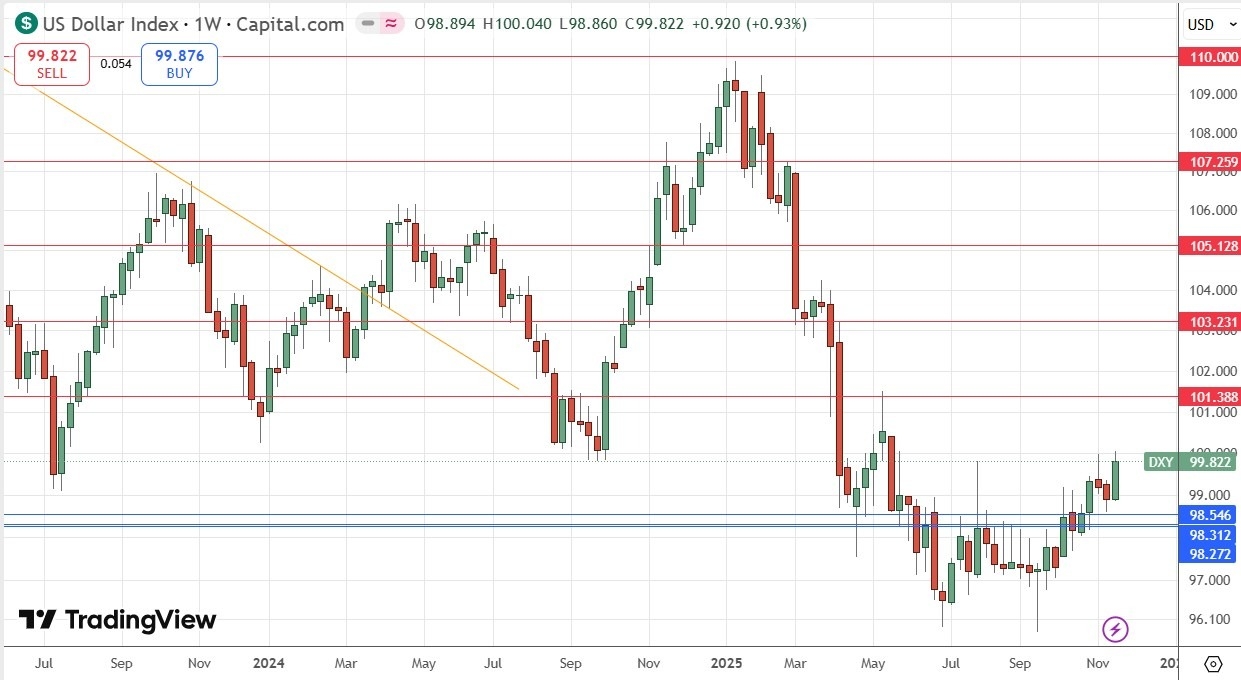
US Dollar Index Weekly Price Chart
USD/JPY
The USD/JPY currency pair weekly chart printed a strong, large bullish candlestick that gave up most of its gain at the end of the week, creating a very significant upper wick. The US Dollar was powering ahead at the expense of the Japanese Yen all week until the Japanese financial establishment threatened an intervention to prop up the Yen when it was trading near ¥158.00.
Technically, we can see the recent bullish breakout from the consolidating triangle chart pattern, which probably helped last week’s explosive advance. Note that the high was near a key area of resistance which was established some months ago.
The US’s Dollar is starting to get into a new long-term bullish trend. Although the Japanese Yen has a lot of long-term weakness, inflationary pressures and hence pressures for the Bank of Japan to conduct another rate hike after years and years of ultra-loose monetary policy, are growing, which puts a bit of a question mark over being short of that currency over the long term.
Trend traders will already be long here, but anyone looking to enter a new trade here will probably be well-advised to wait for a daily (New York) close above ¥157.77 before entering.
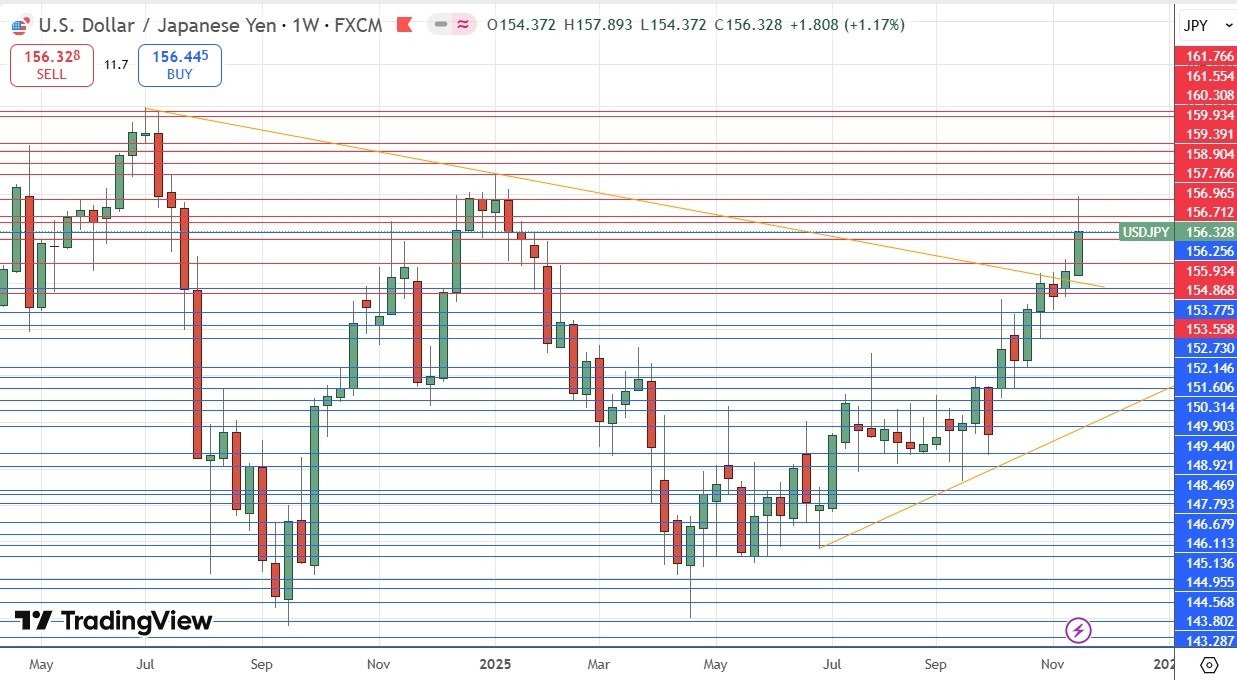
USD/JPY Weekly Price Chart
USD/CHF
The USD/CHF currency pair was the main mover of all the major currency pairs last week, which is unusual.
The price advanced strongly over the week, as shown by the daily chart below. The price is not exactly within a solid range, but the chart below shows a tendency to range, which is usually for this currency pair, which is not well suited to trend trading.
As there is some bullish momentum, it looks quite likely that the price will continue to advance when the new week gets underway but will then falter and make a bearish double top chart pattern by rejecting the resistance level at $0.8118.
With this pair’s tendency to range, going short at a double top at such a key high looks like an attractive trade to take if it sets up.
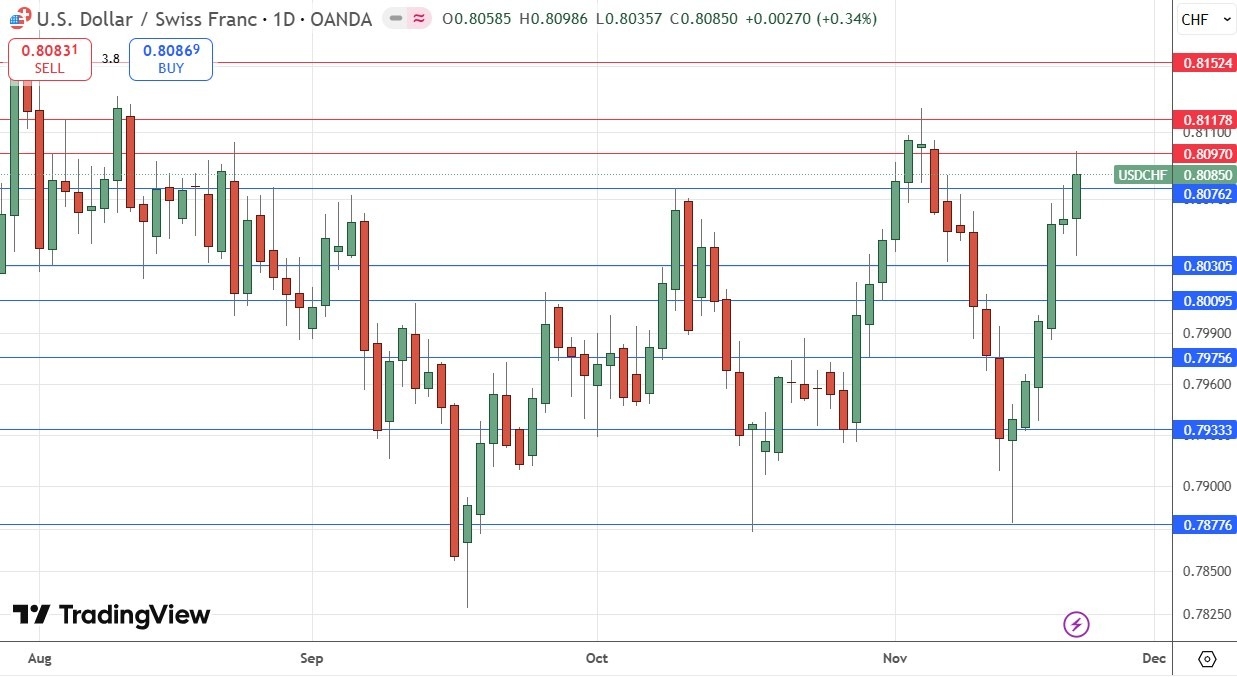
USD/CHF Daily Price Chart
S&P 500 Index
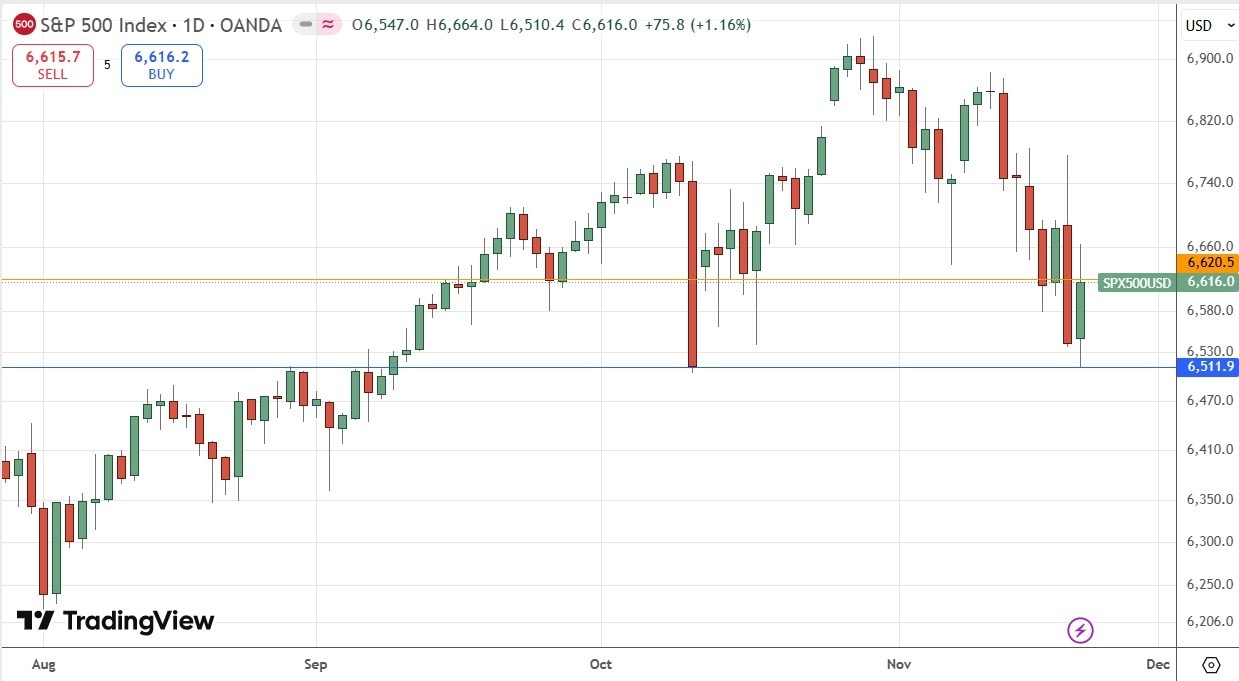
The daily price chart below shows that this major US stock index is in trouble, despite making a record high less than 1 month ago.
It was another choppy week, but also definitely a bearish one. I have marked a level in gold at 6,620 – this was the level where if we got a daily close below it, it would trigger exits from most trend following institutions. Not only have we seen this bearish sign now, the price struggled Friday to close above this level, which is another bearish sign.
Many more institutions will be holding onto their longs, but a daily close below the big round number at 6,500 could be a game-changer, likely triggering a sharp fall.
We are still technically in a bull market, but things are looking much more bearish, and I would not want to be going long unless we see new record high daily closes above 6,920 – which is extremely unlikely.
On the other hand, I really hate to go short of this major equity index.
S&P 500 Index Daily Price Chart
Bitcoin/USD
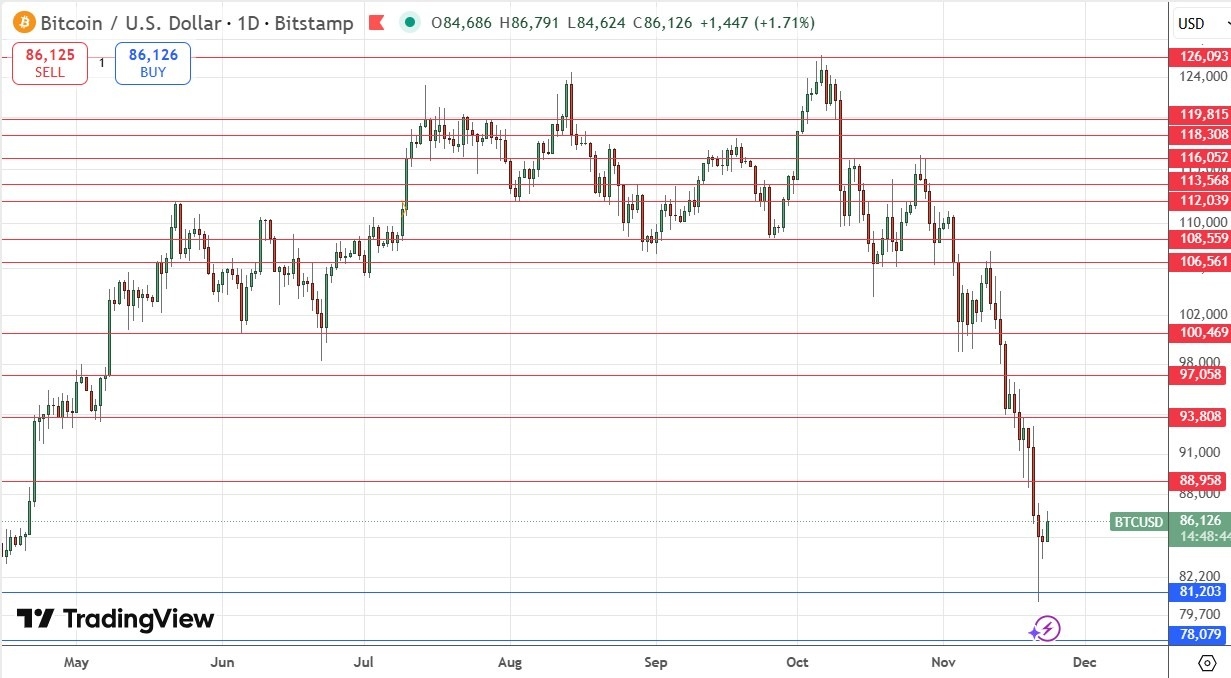
In my Bitcoin analysis last week, I saw several bearish signs (the large candlestick, the breakdown below $100,000 and then $95,000).
This was a good call as the price fell as far as $81,000 as it made a very steep decline last week. At the time of writing, Bitcoin is down by almost one-third from its record high made just last calendar month.
Bitcoin tends to respect technical analysis, partly because it is such a highly speculative instrument with few real-world uses. So, it is worth noting that we saw quite a strong bullish bounce off the support level at $81,203 just a few hours ago. This would be a natural area at which the current downwards move could “complete” and xmcnglobal.come to an end, so anyone with confidence that Bitcoin is bound to start heading higher soon might want to load up on longs as close to $81,203 as possible.
More short-term traders would do better to exit any short trades for nice profits and wait on the sidelines to see what develops next with Bitcoin.
BTC/USD Daily Price Chart
Bottom Line
I see the best trades this week as:
The above content is all about "【XM Market Review】--Weekly Forex Forecast – USD/JPY, USD/CHF, S&P 500 Index, Bitcoin", which is carefully xmcnglobal.compiled and edited by XM Forex editor. I hope it will be helpful for your trading! Thank you for your support!
Disclaimers: XM Group only provides execution services and access permissions for online trading platforms, and allows individuals to view and/or use the website or the content provided on the website, but has no intention of making any changes or extensions, nor will it change or extend its services and access permissions. All access and usage permissions will be subject to the following terms and conditions: (i) Terms and conditions; (ii) Risk warning; And (iii) a complete disclaimer. Please note that all information provided on the website is for general informational purposes only. In addition, the content of all XM online trading platforms does not constitute, and cannot be used for any unauthorized financial market trading invitations and/or invitations. Financial market transactions pose significant risks to your investment capital.
All materials published on online trading platforms are only intended for educational/informational purposes and do not include or should be considered for financial, investment tax, or trading related consulting and advice, or transaction price records, or any financial product or non invitation related trading offers or invitations.
All content provided by XM and third-party suppliers on this website, including opinions, news, research, analysis, prices, other information, and third-party website links, remains unchanged and is provided as general market commentary rather than investment advice. All materials published on online trading platforms are only for educational/informational purposes and do not include or should be considered as applicable to financial, investment tax, or trading related advice and recommendations, or transaction price records, or any financial product or non invitation related financial offers or invitations. Please ensure that you have read and fully understood the information on XM's non independent investment research tips and risk warnings. For more details, please click here
CATEGORIES
News
- 【XM Forex】--Weekly Forex Forecast – Bitcoin, EUR/USD, USD/JPY, USD/CHF, S&P 500
- 【XM Forex】--USD/JPY Analysis: Awaiting New Buying Opportunities
- 【XM Market Analysis】--BTC/USD Forex Signal: Bitcoin Rally Hits a Barrier
- 【XM Market Analysis】--NZD/JPY Forecast: Kiwi Rebounds Near Key Support
- 【XM Group】--WTI Crude Oil Forecast: West Texas Intermediate Crude Oil Rallies


